By Paul Giles
Summary
With ONS 2024 full year trade data just available, we now have four years’ UK-EU goods exports data to use in judging trade trends and estimated Brexit “hit”.
By definition, there will be some “hit” given that 2021+ government “Global Britain” trade policy specifically de-emphasised the EU vs more distant markets.
This article estimates the hit in real terms as around £100bn to date, perhaps £600bn by 2035 on the assumption that the real value declines seen for the past nine quarters now stop.
Given that such estimates are routinely dismissed by those still wishing to defend Brexit, we include for the first time specific quantified rebuttals of common challenges.
As each year passes, it becomes less and less disputable that Brexit has introduced a substantial and – worse – ongoing hit to trade and it is encouraging that our current government, through closer EU links, have an interest in curtailing it.
Graphing it all
Replacement of the single market with the Trade and Co-operation Agreement (TCA) in January 2021 was always going negatively to affect UK-EU goods exports. After all, the policy was to focus wider afield as “Global Britain”, “pivoting away” from trade with the EU.
The 2024 full year ONS trade figures were released on 13 February, giving us four years’ post-TCA goods exports data. So where are we, and what are the various economic commentators saying?
At the extremes of Brexit support, a minority argue that there has been a “small” or even “no trade hit at all”. They often support such assertions with “current price”(CP) data when comparing, say, 2024 with 2021, the high levels of inflation in that period disguising the falls.
In government, ministers are more careful, the preferred tactic being to avoid talking at all about any hit to UK-EU, and rather focus instead on the alleged “huge Brexit wins” of non-EU FTAs such as the CPTPP. Ministers have been uninterested in hearing that any gains from the non-EU FTAs are not only tiny compared with EU trade losses, but will not arrive until a decade hence, whereas the UK-EU hit started three years ago.
For answers, here’s the latest ONS data charted to help estimate the hit suffered.
First of all, chart UK-EU goods trade in CVM – i.e. volume data, inflation-eliminated – terms right back to 1997, 28 years ago:

Four factors immediately strike the discerning reader:
- The 22 years to 2018 show a rising real values trend, about 1% annualised;
- The 2019-20 period of Commons vote and Covid volatility;
- That the 2019-20 period reflects a one-off disruption, and is not relevant to ongoing trend;
- That the trend restarts in 2021-24, and is now at -7% annualised, giving a value hit of £126bn.
The above minority will routinely dismiss such a chart, sometimes offering one of their own with CP data although claims based on CP are now far fewer.
When pushed, the arguments against a chart such as the above are any or all of:
- EU growth is low and their total goods imports are falling, including from us;
- Global goods exports have stalled, by definition including UK-EU goods exports;
- It’s due to Covid and/or an ongoing “long Covid-based” deterioration in UK industry;
- Other economic misinformation such as GDP comparisons;
- A selection of more crazed suggestions, e.g. the ONS are manipulating the figures.
These points can have validity, so we need to address them, as per below.
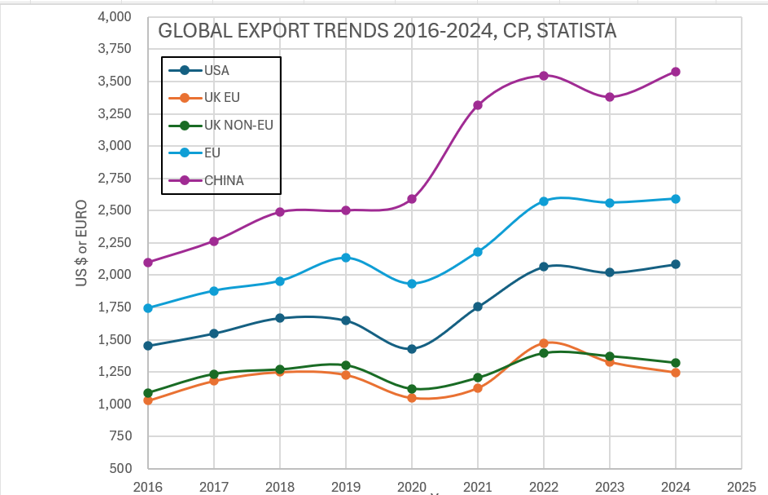
EU total imports have fallen
While we have to move to CP as this is the only data easily available, this is not a problem as we are only interested in trade trends.
The “TCA period”, i.e. 2021-24, is the one under examination but a 2018 data startpoint is used to eliminate the Commons and Covid disruption.
The chart below makes obvious:

- Trends clearly following those of the UK chart above;
- That EU global imports have risen in 2021-24, not fallen, by 6.45% annualised;
- That US global imports in comparison have risen similarly, by 6.74% annualised;
- That UK-EU goods exports CP show a weaker following of the same trend;
- That even in CP terms, UK-EU shows a 0.06% annualised fall;
- That adding the two, this indicates UK-EU exports being about 7% below the EU average.
In conclusion, EU global goods import values have risen, not fallen, so this factor does not explain the UK-EU decline.
“Global goods exports have stalled”
The chart below makes clear that this is not the case:
Interestingly, this chart also deals with the third challenge above “UK-RoW goods exports have fallen too…” given that UK-EU and UK-RoW have been separately charted. Although not totally clear here, a CVM chart clearly shows UK-EU values being above UK RoW before slipping below RoW in 2023 and 2024, showing the Brexit-specific impact.
“It’s due to Covid”
The above charts allow Covid to be isolated, treating it as one-off situation not relevant to trade trends.
Economic misinformation
The complexity of this topic and the widely varying levels of understanding of economics across the UK population apparently has led opportunistic individuals to circulate a limited amount of misinformation subsequently to be amplified via social media. Examples include:
- “UK GDP growth is the same as the EU so Brexit has had no effect”
On the face of it a highly persuasive point but largely incorrect in terms of UK-EU trade. Say both UK and EU 2024 growth is 1%. There are thousands of businesses, exports/imports and other factors within that 1%, some positive, some negative some neutral. One of those many factors is the Brexit GDP hit and let’s call that 0.2% for the UK for 2024.
So, mathematically, it doesn’t actually matter if the country’s GDP growth is 1%, 5% or even 10% (!). Without Brexit it would be 1.2%, 5.2% or 10.2%. It’s a loss regardless.
- “The EU is in chaos”
Undoubtedly there are political challenges and fallout from Ukraine. But again, this is of limited relevance. The EU markets with which we need to trade, as in the charts above are still there and still by far our largest.
- “The EU’s proportion of world trade is shrinking”
Maybe, but what matters mathematically to the UK is the percentage of UK trade with the EU, not the percentage of EU trade with the rest of the world.
This is also known as the “I wouldn’t have started from here” explanation, i.e. if the UK were a brand-new country today with no trading links with anyone, we could look first at a justification of trade links to faster growing, albeit more distant countries as an alternative to our nearest neighbours.
But starting “from here”, i.e. being realistic, the UK has to give up existing EU trade in order subsequently to start searching for non-EU FTAs which (as per above) leads to a net loss for the UK.
So what is our best estimate of the Brexit hit to UK-EU goods trade?
The chart below, an extract from the first one above, provides an estimate of the hit.
It recognises that UK-EU was growing by 1% annualised (above) in real terms in the 1997-2018 period and then falling by 6% in 2021-2024, a net 7% annualised loss.
The chart also factors in the effect of non-EU FTAs based on the Department of Business and Trade’s impact analyses, which publish the value and timing of the projected export gains.

We see a hit of £125bn to date and £700bn assuming the 7% decline becomes 0% with immediate effect.
Undoubtedly, these “exact” values cannot be entirely the result of the TCA. Beyond our efforts above to isolate global factors, other factors entirely unconnected with UK-EU have surrounded the last four years and could have introduced a greater negative effect on UK trade than existed in the 1997-2018 period. We should also note that these global factors could be positive relative to 1997-2018, meaning an even greater Brexit hit (!).
One guide is given by UK-EU being 7% annualised below global-EU imports 2021-2024 (second chart above). This percentage is remarkably close to the 7% annualised we calculated, indicating that at least a substantial amount of the hit is TCA-related.
What we can do is be conservative and say, assuming no more declines, the hit TCA to end 2024 is estimated at about £100bn to date and £600bn by 2035 (ongoing £40bn per annum). And use this as a template to monitor going forward.

