By Paul Giles
[With five years ONS trade data out, we compare pre- to post-TCA UK-EU goods export trends, to judge any impact]
Introduction
“The Brexit deal will protect our economy by delivering a new and ambitious trading partnership with the EU, while freeing us to pursue an independent trade policy.” HM Government, “EU Exit”, early 2019.
Astonishing, is it not, how a body in such a position of influence can write a message of great promise which in truth should convey, at best, the significant risk that announced changes could invoke on the economy?
Ironically, added to those well-intentioned generalities was “On 29 March 2019, the United Kingdom will leave the European Union.” That plan didn’t survive a parliamentary vote! An omen? The risk(s), however, remained silent!
So, the EU withdrawal agreement came into effect in January 2020 followed by the trade and co-operation agreement (TCA) on 1 January 2021 – the brace that launched a thousand scripts?! Still no trade-offs indicated. Did gaining “independent” rights not automatically imply losing dependent ones?
Some scripters wrote that “pivoting away” from the EU implied accepting lower EU trade volumes in favour of larger, prospective non-EU volumes. Post-TCA implementation, others began to claim no impact at all.
One example of the former is the CER’s “Döppelganger UK” approach of UK trade to peers. Embodied in page 59 of the OBR’s October 2021 “Economic and Fiscal Outlook”, supporting then Chancellor Sunak’s 27 October spending review, it quoted a post-TCA reduction in “UK goods trade by 15.8 per cent.” Of the latter, in her 6 November 2023 International Trade Week keynote speech, then Trade Secretary Badenoch quoted “UK-EU trading relations haven’t been negatively impacted by Brexit”, words taken wholesale from a IEA report called “Has Brexit Really Harmed Trade?”.
Using a new approach of comparing current UK-EU goods exports, the type most likely affected by the TCA replacing the single market and customs union, with historical records, now that we have five years of ONS trade data behind us, this article seeks evidence of impact, if any.
Summary
From the analysis outlined below.
The comparison of UK-EU (EU) real value goods exports (export) trends and values pre/post-TCA involved charting the 29 years of exports post-1997. This comprised the 22 years up to end 2018, traded under the SM and CU, vs the five years from 2021 to date under the TCA. Years 2019 and 2020 have been excluded given the extreme trade volatility during of those years resulting from non-trade events.
A summary of observations:
- Volatility and trends: the entire dataset shows volatility including multi-quarter consecutive export downtrends followed by recovery; the five-year period, however, uniquely includes a 12-quarter consecutive downtrend without, to date, recovery.
- Trade values: the 2025 Q4 export value is about £9bn less than its 2018 Q4 pre-TCA comparative, an ongoing annual shortfall of about £36bn or about £500bn by 2035 (normal ONS forecast horizon) should current levels be sustained. Charting US and China goods exports to the EU during the same five-year period shows that no wider global decline could explain that fall.
- Statistics: the 22 years’ quarterly average percentage change in export values is +0.48%, the five years’ -0.49%. Whilst this may ‘prima facie’ indicate a trend change, volatility means a high σ, thus the five years isn’t significantly statistically different from the 22.
- Non-EU exports: EU exports historically have been of the same or higher values than non-EU exports; through the five years EU falls significantly below non-EU, also without recovery; this indicates a factor, and only TCA implementation offers an immediate explanation, uniquely affecting UK-EU.
Conclusion? The risks? The omen? What, across the most recent five years came to pass that was distinct from history? There is no doubt that many independent factors have contributed to EU export volatility over the past 29 years, undoubtedly some or all of these will continue to exert an impact, both positive and negative. Also, unidentified new factors and/or volatilities may have recently entered the equation and even a 2026+ recovery cannot be ruled out. Future data will help clarify.
Despite this, the identified EU export declines which almost exactly match the post-TCA implementation date indicate an overall net negative impact directly related to that treaty. More ONS EU export data as time passes increasingly will confirm this.
Analysis
EU exports – quarterly real values 1997 – 2025 trend
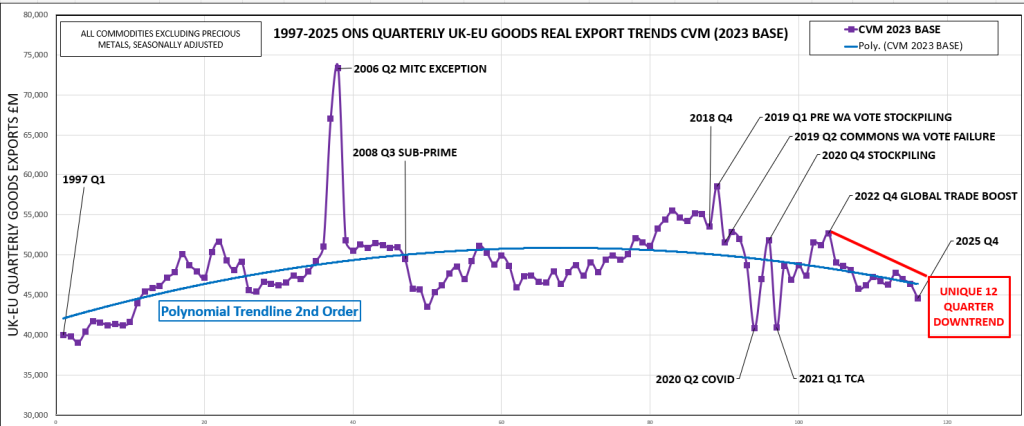
Figure 1 charts the above from ONS data. The TCA shows up alongside global events impacting trade.
Key observations include:
- significant volatility throughout the dataset, with downtrends immediately followed by recoveries;
- the 12-quarter downtrend without recovery, 2022 Q4 to 2025 Q4, within the five years, however, is unique;
- average of the quarterly percentage movements is +0.48%, first 22 years, 1997-2018, -0.49 last five;
- volatility is reflected in “huge” standard deviations of 5.4 and 7.3 for the same movements, same periods;
- a second-order polynomial trendline shows a clear rise and then fall across the 29 years;
- the rise/fall trend can be decomposed into +1.34% annualised for the 22 years and -4.5% for the five years.
Figure 1
EU exports – quarterly real values 2018 and 2025
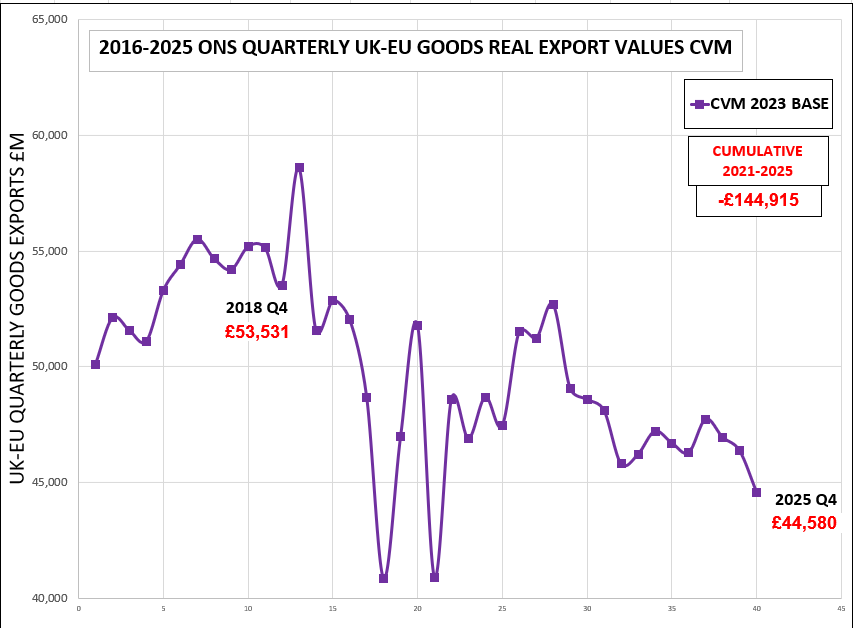
Figure 2 extracts the 2016 to 2025 period from Figure 1 and adds pre- and post-TCA export values
Key observations include:
- a fall in export values of £8,951m from 2018 Q4 to 2025 Q4, cumulatively £144,915m across the five years;
- a possible “stabilisation” of export values at a “new” 2025 quarterly level of about £45bn;
- stabilisation at this new level would indicate an annual fall of about £36bn or about a £500bn cumulative fall by 2035 vs 2018.
Figure 2
Additional analysis
Some additional analysis is required. We need to determine:
- Whether events affecting global trade, rather than the TCA, could be behind our observations.
- How EU exports compare with non-EU, where the TCA is irrelevant.
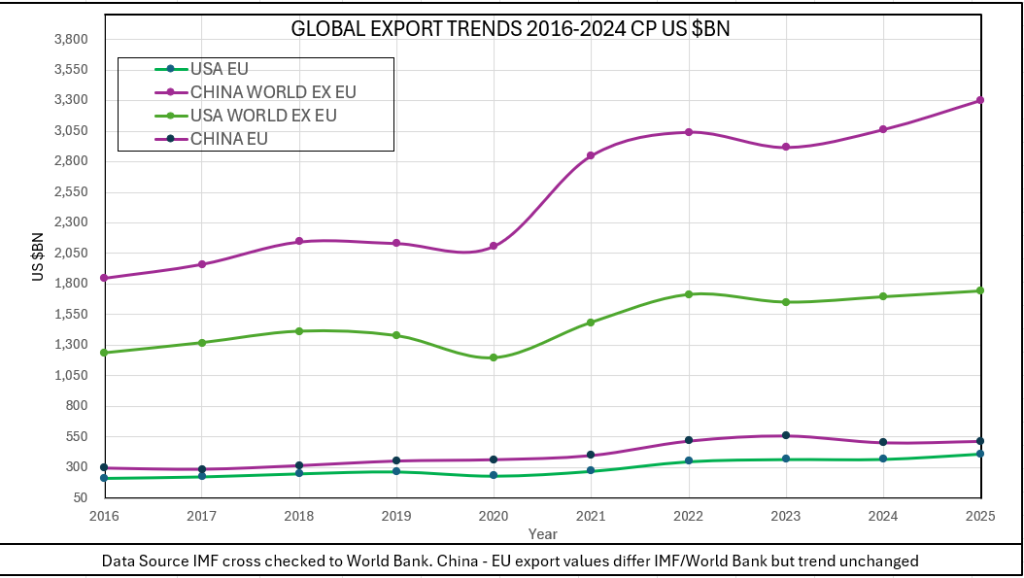
Regarding (a), Figure 3 charts the EU goods exports of the world’s largest two trading nations – the US and China – across the five years. Current as opposed to real prices are used here, given the difficulty of obtaining the latter but are adequate for demonstrating trends here.
We see the Figure 1 2022 “global trade boost” but neither nation shows a significant fall in goods exports to the EU though the five years.
Figure 3
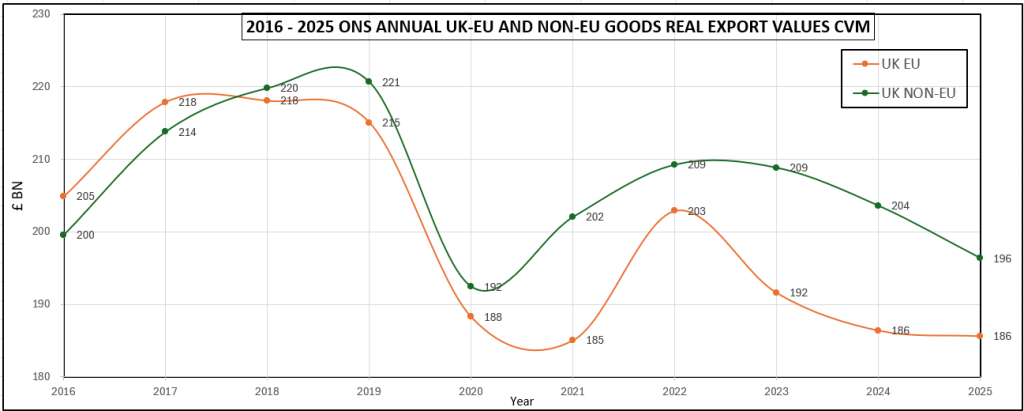
Regarding (b), Figure 4 charts exports both to EU and non-EU.
Again we see the 2022 “global trade boost”. Then, we see both EU and Non-EU goods exports falling but, significantly, EU falls significantly below non-EU from TCA implementation, indicative of the TCA having a specific negative impact on EU.
Figure 4