By Paul Giles
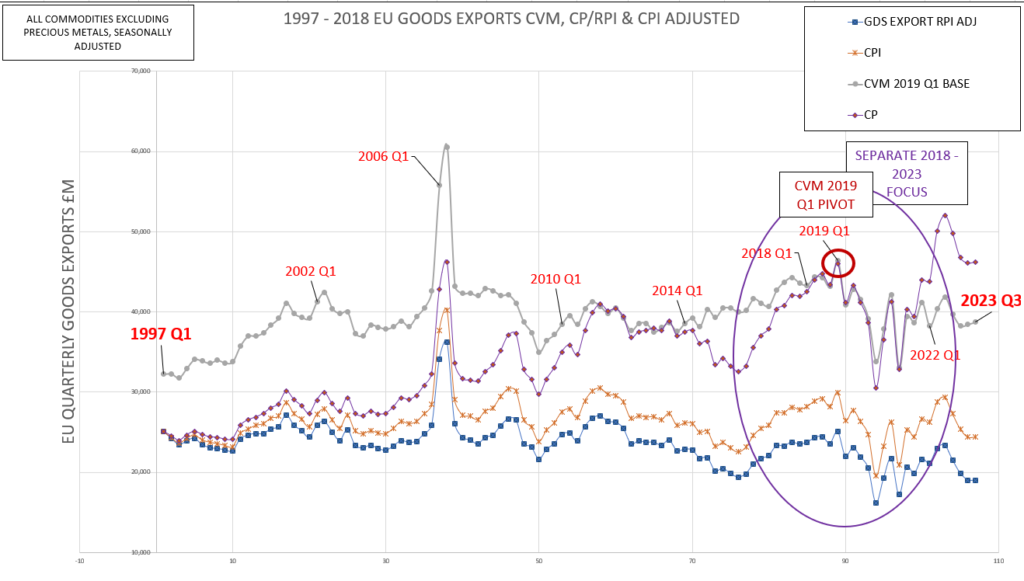
Recent articles quote “UK-EU goods exports are at record levels”. It should be clarified that, in real terms, this is not the case.
If one compares ONS current (Q3 2023) real UK-EU quarterly goods export values, i.e. with the effect of price inflation removed (“real values”) to those for 2018 Q4, the second highest real value to date (charts below), a quarterly shortfall of £3.8 to £5.8bn, about £15 – £20bn per annum, is clear.
While the immediate subsequent quarter, 2019 Q1, is technically the historically highest and would significantly increase the shortfall, it is seen as boosted by pre-Brexit stockpiling and so ignored here.
The charts show not only ONS chained volume measures but also retail price index/consumer price index-adjusted current prices for real values. They demonstrate:
- annualised 0.7% growth 1997 (earliest ONS data) to 2018 (last stable “pre-Brexit” period) followed by an annualised 5.5% decline, TCA (2021 Q1) to date (2023 Q3);
- the known volatility/decline of the 2019/20 WA/Covid period, now behind us;
- the subsequent partial recovery (to 2022 Q3) followed then renewed decline to date;
- that current levels may be the “new post-Brexit norm” although any fresh recovery requires monitoring;
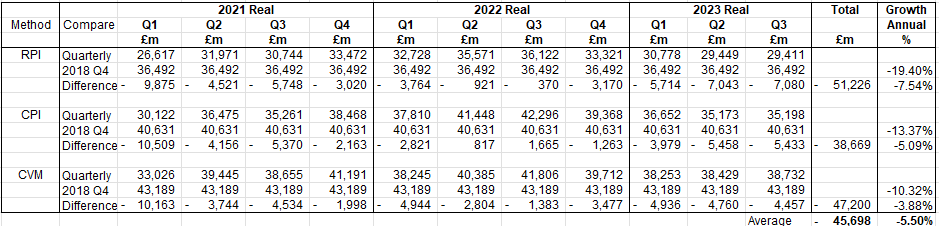
- that the shortfalls TCA to date total about £45bn.
- Total period, 1997 Q1 – 2023 Q3 (26.5 years)
The real values charted are seasonally adjusted and exclude precious metals.
Through adjusting CP values by RPI/CPI values, we obtain equivalent real values which can help substantiate CVM. The unadjusted CP values are also included in the first chart.
It can be seen that the unadjusted CP and CVM values pivot around the ONS’s chosen 2019 Q1 CVM base. Accordingly, in order to calculate the 1997 to 2019 CVM historical equivalents, the pre-2019 unadjusted CP values are actually “upgraded” by inflation to 2019. This gives a variance to actual unadjusted CP values, invalidating any pre-2019 direct value comparison with CVM. The RPI/CPI-adjusted CP trends can be compared with those of the CVM, however. Correlation at 0.6 and 0.8 respectively indicates a “good”/“strong” match. This not only backs up CVM but means that RPI/CPI-adjusted CP values have some validity in trend estimation where CVM is unavailable.
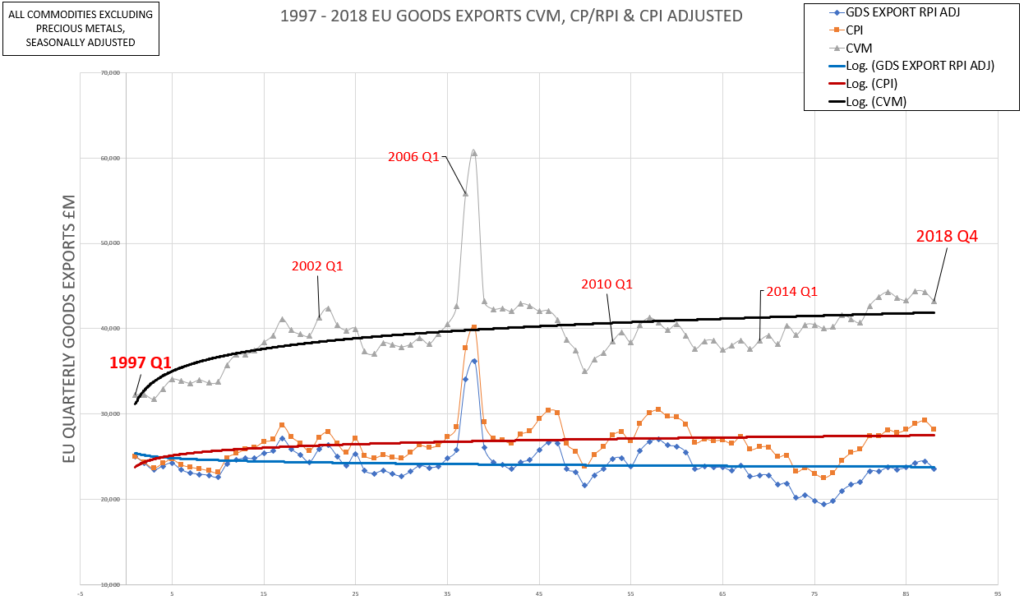
2. Pre-WA/TCA period; 1997 Q1 – 2018 Q4 (21.75 years)
The real values shown by two of the three graphs, despite fluctuations, have rising logarithmic growth trendlines across the period, the third a marginal fall. Overall positive average growth is:
- CVM +1.36%
- RPI -0.28%
- CPI +0.54%
- Average +0.66%
2018 Q4 represents the “pre-Brexit endpoint” given the above 2019+ volatility, introduced by stockpiling associated with multiple failed Parliamentary attempts to pass the EU WA. Other reports also suggest a Brexit effect on 2016 Q3 to 2018 Q3 real values but this is not detected here.
RPI/CPI-adjusted CP to CVM correlation for this period is 0.6/0.8, still good/strong.
3. WA to current; 2018 Q4 – 2023 Q3 (4.75 years)
All three trendlines show falling trends; by 2023 Q3 we see vs 2018 Q4:
- quarterly real shortfalls of £3.8 to £4.6bn;
- a real CVM shortfall of £5.8bn vs a continuing 1997-2018 growth trend.
These levels may be a new “post Brexit norm” or a temporary fluctuation. Monitoring will clarify.
This period can be subdivided into three sub-periods, the first two reflecting a specific trade-relevant business event (below).
RPI/CPI-adjusted CP to CVM correlation for both for this period is 0.9, strong.
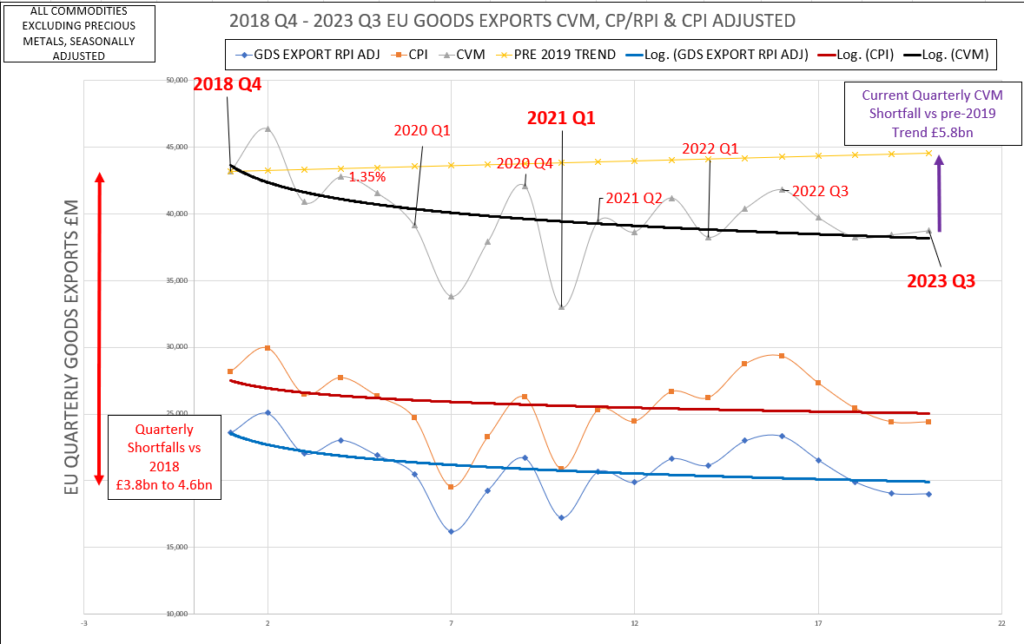
4. Sub-periods, 2018 Q4 – 2023 Q3
The three sub-periods are (a) “Brexit uncertainty” followed by Covid lockdowns (b) decline with TCA implementation and partial recovery and (c) subsequent decline.
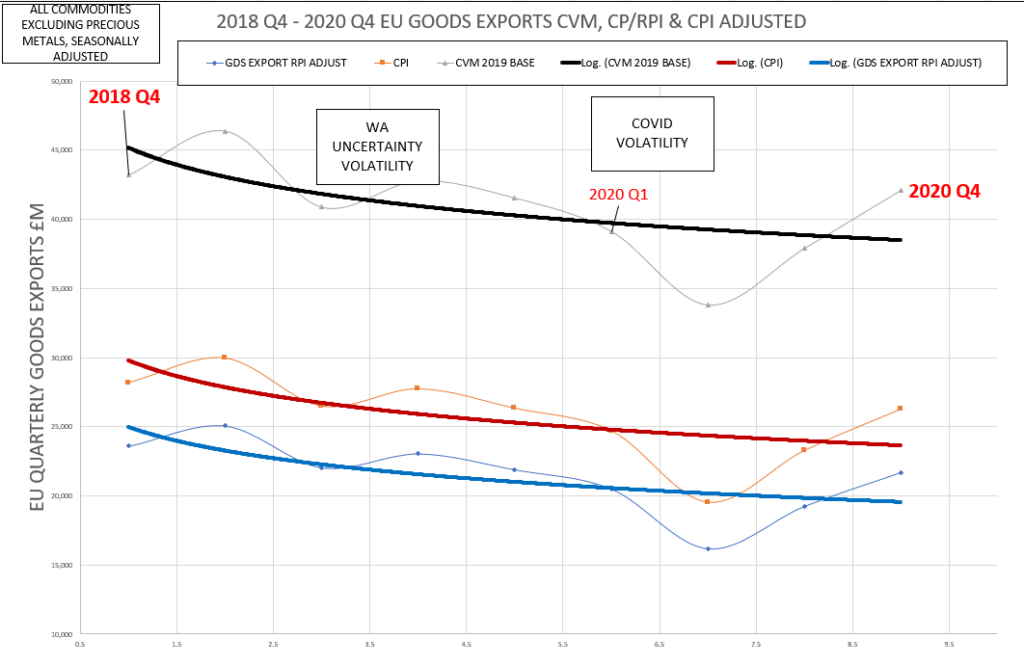
a) Brexit uncertainty and Covid lockdowns, 2018 Q4 to 2020 Q4 (2 years)
All three trendlines show significant falls during temporary WA/Covid volatility.
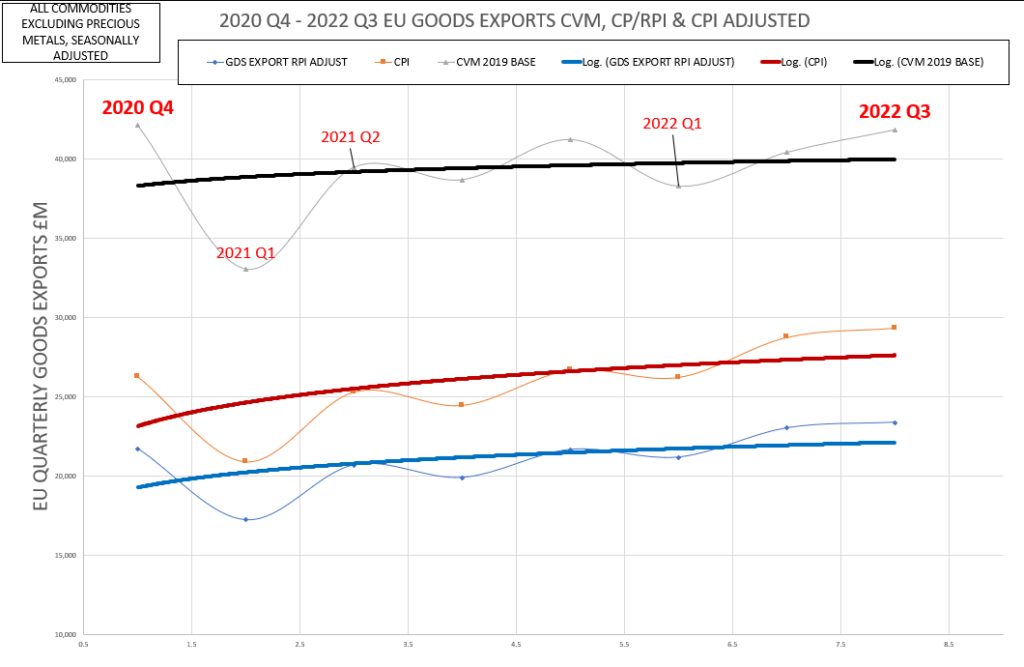
b) Decline with TCA implementation and partial recovery 2020 Q4 to 2022 Q3 (1 year 9m)
Sharp 2021 Q1 TCA implementation fall was followed by all three trendlines showing a partial recovery; the CPI trendline regains the Q4 2020 level but all trendlines fall significantly short of 2018 real values.
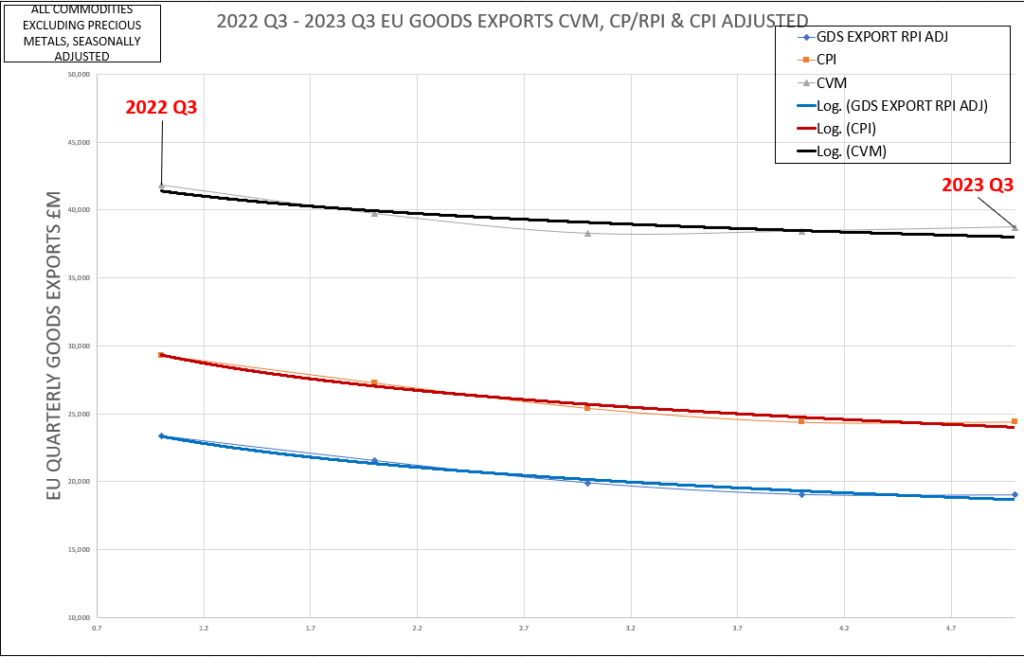
c) Declining trend 2022 Q3 to date (2023 Q3, 1 year)
All three trendlines show significant declines for the four quarters to date.
5. Values shortfall TCA to date (2 years 9 months)
Totalling the quarterly shortfalls since 2021 Q1 TCA implementation gives an average of about £45bn across all three methods.
UK trade: goods and services publication tables – Office for National Statistics (ons.gov.uk)

