By Paul Giles
“EU exports have returned to pre-Brexit levels.” Have they?
Having duped an electorate with misleading economic data in 2016, a few politicians, from government ministers down, continue to “try it on” with further falsehoods!
Delivery of information which the speakers themselves must know is incorrect, in the hope that listeners will lack the time or inclination to find the flaws and thus again be taken in, shows no respect for the electorate.
The value of UK goods exports to the EU, for example, while close to pre-Brexit levels in current price terms – i.e. the unadjusted price of the goods – are well short of pre-Brexit values in real terms, i.e. after removing the effects of price inflation.
Here’s the “relevance of real”. If we just compared trade values at current prices we could, for example, take the 1952 total of UK goods and services exports (£3.8bn), compare them with, say, the 2018 total (£642bn) and congratulate ourselves on a 17,000% exports increase. Is it such increase though? Of course not! Would the landlord of the Pandora Inn accept 9p today for a pint (that’s the 1952 price of a pint, then known as one shilling and 10 pence)? Of course not; in which case current and 1952 values can’t be directly compared; we need to adjust 2018 up or 2023 down by inflation before we can.
It follows that we can’t even compare this year’s values with those of last year except when inflation has been zero, which we know it definitely hasn’t! And it further follows that we certainly can’t compare 2018 values with this current year current. 2018 is generally accepted as the most recent “stable” year for UK-EU trade (2019 was disrupted through multiple false “leaves”, 2020 by lockdowns, both being non-EU trade events).
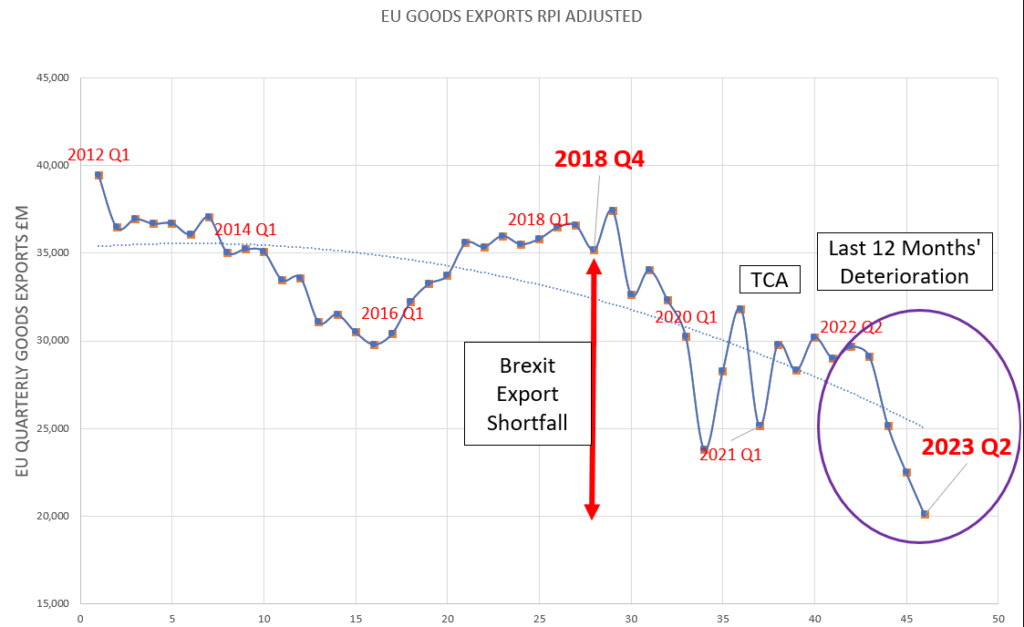
So, for EU goods exports how can we compare “apples with apples” in order to see if trade has indeed “returned to pre-Brexit levels”? Well, we can adjust for the classic retail price index. This has been charted below for the eleven years from 2012 to date. The result is a current trade shortfall @2018 values of £15bn per quarter.
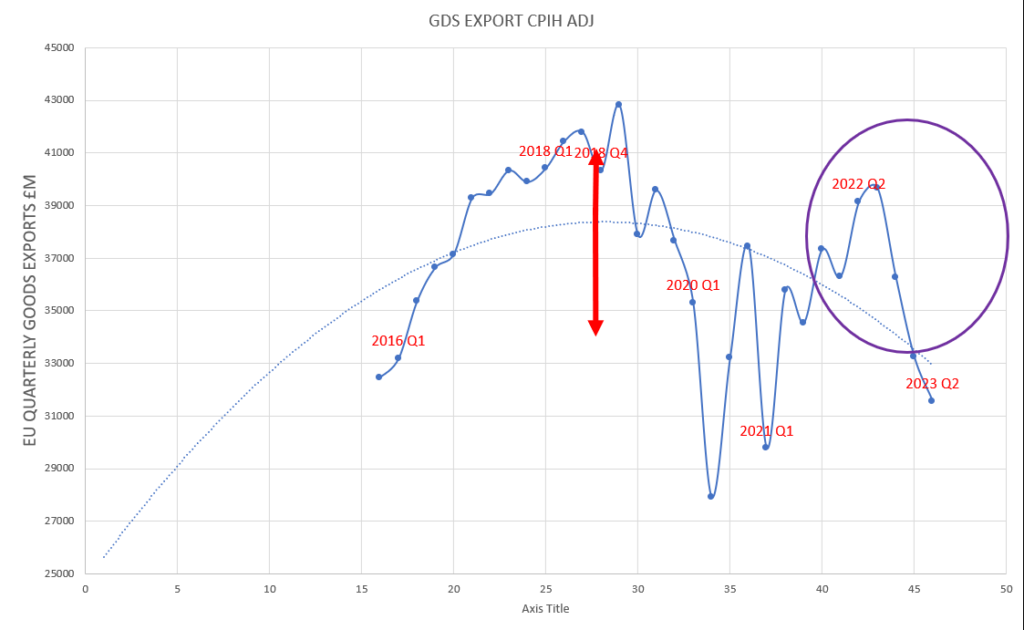
Some prefer a different measure of inflation, CPIH, i.e. consumer price inflation including housing costs. With this, charted below, the shortfall is now much smaller at about £7bn per quarter. The critical point, however, is that despite changing the inflation measure there is still a shortfall and it’s in the same direction and at the same time and it’s significant.
A third “real” measure is the ONS’ own chained volume measures values, CVM. These use a 2019 price base = 100 whilst above we were able to “user define” the 2012 price base for the RPI chart and the 2015 base (earliest data available) for the CPIH chart. All the same, we still have a significant shortfall of about £5bn per quarter.
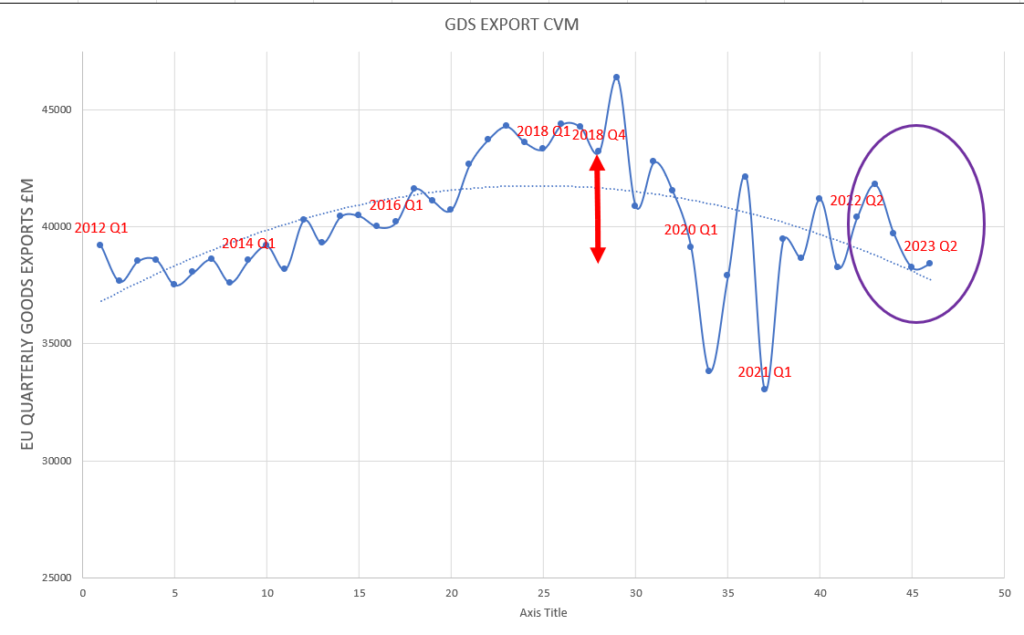
So, whichever method we use to remove price inflation, a significant shortfall in EU goods exports values is seen and this also coincides exactly with the replacement of the single market with the Trade and Cooperation Agreement, the TCA.
Beware of false prophets!
Incidentally, all three charts likewise show the 2019 volatility resulting from the multiple failed attempts for the Commons to vote in favour of the Withdrawal Agreement, and also a significant and consistent fall in real goods export values through the past year.


An excellent, if depressing piece of work, and well articulated. It is very obvious to most people involved with imports/exports that volumes are down when compared to 2018. More clear and concise articles such as yours are required.
Thank you for your comment, Nicholas. We are lucky to have Paul writing for us, he always produces accurate detailed reports that provide true facts that are not always readily available.